Grafana - Facebook Integration
1. Introduction
With Facebook integration in Grafana, you will get actionable insights into traffic metrics to maintain efficiency and effectiveness. It is an additional tool for monitoring the traffic of messages sent by Facebook.
2. Facebook Integration
This integration includes a useful pre-built dashboard for Facebook as a customer, which will be installed in your Grafana instance, to help you monitor and visualize the traffic metrics we receive from Facebook.
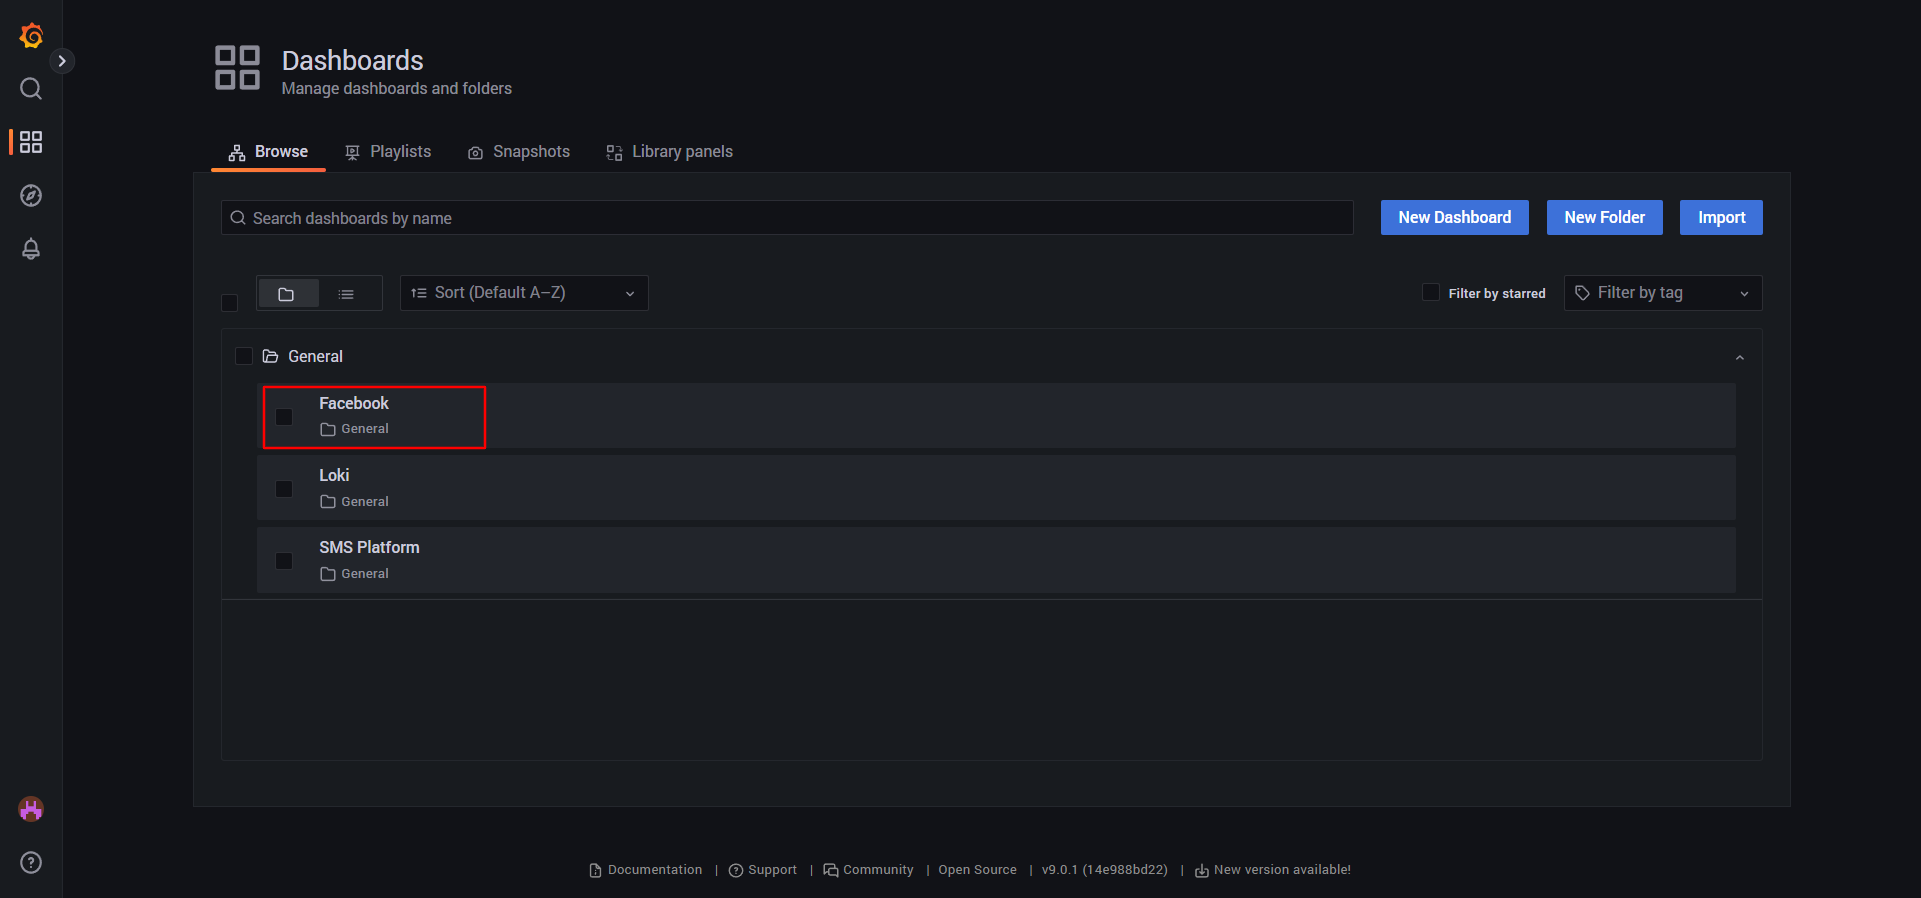
On the next screenshot you can see where you will find the link to your Facebook dashboard in Grafana.
Click-through Rate (CR) is a key metric for Facebook, which tracks whether end users use data from the sent messages (link, OTP, etc.). Facebook sends us files with the traffic data, that we process with the specially developed script. We import the processed data into Grafana and present it through specially programmed and designed tables and graphs for better visualization and real-time monitoring.
When you open your Facebook dashboard, you will see the panels with presented data for the default selected operator. You can easily change or add an operator using the select button at the top-left corner of the screen. After selecting an operator, new fresh data will be presented on the dashboard panels, and you will be able to see how Facebook sees the traffic of sent messages through your Platform. The dashboard panels report data by 15 minutes intervals for detailed monitoring.
From the dashboard panels, you will find the CR for the messages sent through your Platform reported by Facebook, and also the best CR they achieve with other suppliers. You will also find these data for the last 24 hours.
An example of presented data on the Grafana Facebook dashboard you can find on the next screenshot.
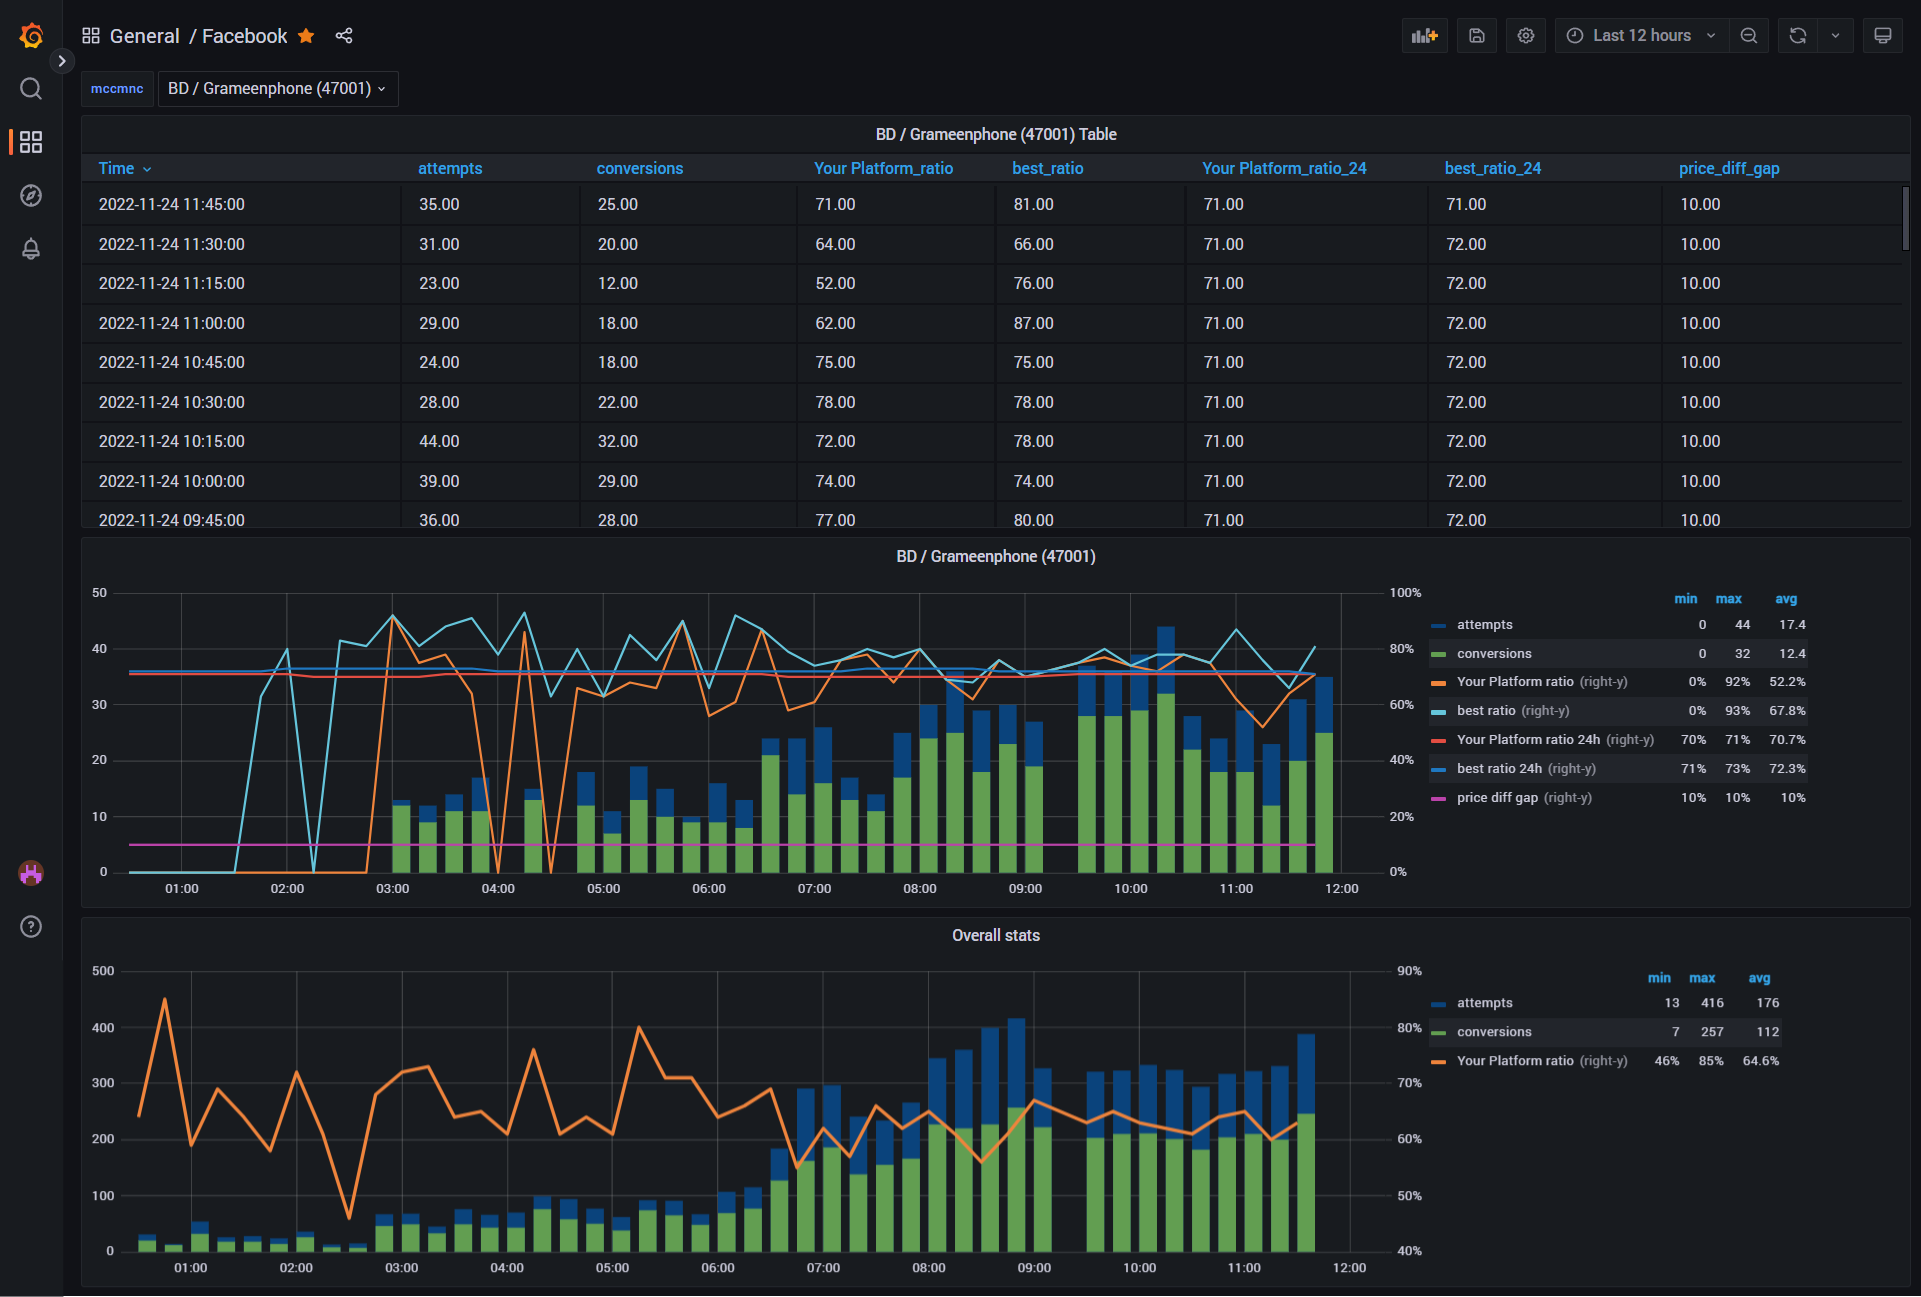
By monitoring the reports in Grafana for the data that Facebook sends us, you may identify time periods with low CR for messages sent through your Platform and proactively highlight potential issues. As the dashboard panels report data by 15 minutes intervals, you can use them for detailed and closely monitoring for any critical issues that might have significant negative impact on sales or other metrics. You can use these insights for further data exploration in your Platform statistics, and take action if necessary to maintain the traffic.
This enables more effective monitoring, problem diagnosis, and traffic redirection to ensure better delivery of sent messages and prevent traffic loss.